The Next Round in the EU–US Tariff Battle: What’s the Impact on API Supply?

Facing a potential US tariff of 30% coming due on August 1, European Union leaders are mapping out a trade strategy. What’s the impact on pharmaceutical supply chains?
By Patricia Van Arnum, Editorial Director, DCAT, pvanarnum@dcat.org
Next move on tariffs
Evolving US trade policy took another turn last week (July 11, 2025) when President Donald Trump announced imposing a 30% tariff on European Union (EU) exports into the US, effective August 1, 2025. In a letter to Ursula von der Leyen, President of the European Commission, dated July 11, 2025, President Trump said such tariffs would be imposed to address the US trade deficit with the EU and that no tariffs would be imposed if the EU or companies in the EU decide to build or manufacture products in the US. He added that if the EU were to impose retaliatory tariffs in response, the US would add the amount of those tariffs in addition to the 30% tariff.
In response, European Commission President von der Leyen, in a statement on July 11, 2025, acknowledged the receipt of the letter sent by President Trump and the negative impact of such tariffs on the EU. “We take note of the letter sent by U.S. President Trump outlining a revised tariff rate and a new timeline,” said von der Leyen, in a July 11, 2025, statement. “Imposing 30 percent tariffs on EU exports would disrupt essential transatlantic supply chains, to the detriment of businesses, consumers and patients on both sides of the Atlantic.”
What will happen next is the large question looming for both the US and the EU. Both parties had been in negotiations to reach a trade deal before an August 1, 2025, deadline for the imposition of reciprocal taxes by the US on the EU. August 1 was the second extension that the US had given before implementing reciprocal tariffs, country-by-country tariffs designed to reduce the trade imbalance between the US and its trading partners.
The Trump Administration first laid out a plan for imposing reciprocal tariffs in February (February 2025) to counter non-reciprocal trading arrangements with its trading partners and to improve US competitiveness, including in manufacturing. Those reciprocal taxes were scheduled to go into effect on April 9, 2025, but the Administration placed a 90-day pause (until July 9, 2025) on their implementation to enable countries to negotiate these tariffs with the US government. The US government then extended the deadline again, this time to August 1, 2025, except for 14 countries, which were sent letters from the White House to specify tariffs ranging from 25% to 40%.
The US and EU had been in negotiations to reach a deal on reciprocal taxes prior to the August 1, 2025 extended deadline, but with the US now proposing a 30% tariff on EU goods entering the US, by August 1, 2025, what will happen next is the large question looming for the EU and US.
“Few economies in the world match the European Union’s level of openness and adherence to fair trading practices,” said European Commission President von der Leyen in her July 11, 2025, statement. “The EU has consistently prioritized a negotiated solution with the US reflecting our commitment to dialogue, stability, and a constructive transatlantic partnership. We remain ready to continue working towards an agreement by August 1,” she said in her July 11, 2025, statement. “At the same time, we will take all necessary steps to safeguard EU interests, including the adoption of proportionate countermeasures if required. Meanwhile, we continue to deepen our global partnerships, firmly anchored in the principles of rules-based international trade.”
Impact of tariffs on EU pharmaceuticals
Medicinal and pharmaceutical products are an important part of the EU’s economy and its position in global trade. In2024, EU exports of medicinal and pharmaceutical products increased by 13.5% compared with 2023, reaching EUR 313.4 billion ($364.4 billion), according to information from Eurostat, the statistical office of the EU. At the same time, imports only recorded a modest increase of 0.5%, amounting to EUR 119.7 billion ($139.2 billion).Consequently, in 2024, the EU’s trade surplus in medicinal and pharmaceutical products came to a total of EUR 193.6 billion ($225.1 billion) marking a record high.
The US and Switzerland are the main trading partner for the EU in pharmaceuticals. The US stands out as the EU’s main trading partner for medicinal and pharmaceutical products in 2024. Exports to the US (38%) were almost a two-fifths of all EU exports and were followed at some distance by Switzerland (16%) and the UK (6%). Imports to the EU were also dominated by the US (38%) and Switzerland (33%) followed by the UK (7%). Breaking down the numbers specifically, extra-EU exports of medicinal and pharmaceutical products to the US in 2024 totaled EUR 119.8 billion ($139.3 billion) (38.2% of exports) followed by Switzerland (16.4%; EUR 51.3 billion ($59.6 billion) and the UK (5.8%; EUR 18.2 billion ($21.2 billion)
Flow of APIs and finished dosage forms
Imposing additional tariffs on the EU across the board (barring an exemption for pharmaceuticals) would impact the US market, particularly innovator drugs. Europe is the largest supplier of pharmaceuticals and inputs imported into the US for innovator drugs, and the EU is the largest source of these imports.
Looking at US and ex-US manufacturing of active pharmaceutical ingredients (APIs) on a global basis for both innovator/branded and generic drugs shows the importance of the EU to the US bio/pharmaceutical market. The data are based on the U.S. Pharmacopeia Medicine Supply Map, a data intelligence platform that maps where 94% of US pharmaceutical drug products and their ingredients are made and that identifies, characterizes, and predicts supply-chain risk.
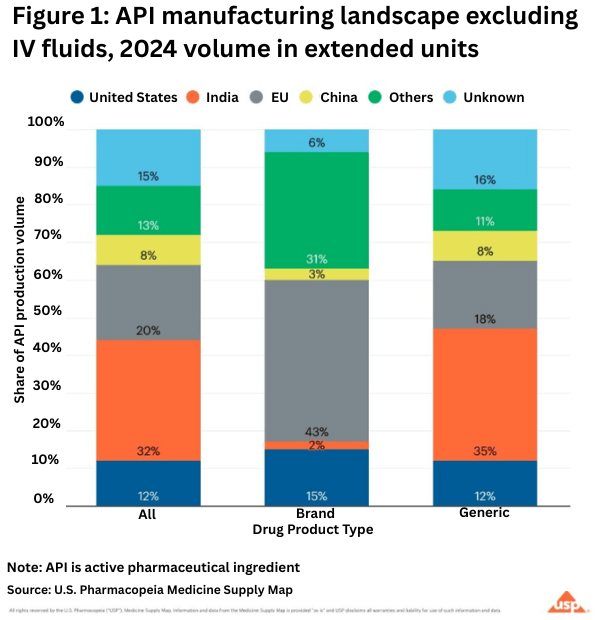
On the API side, the USP analysis showed that in 2024 (see Figure 1 above):
• Half of the APIs for prescription medicines in the US come from India and the EU.
• 43% of branded pharmaceutical APIs comes from the EU.
• Generic drugs, which make up 90% of US prescription drug volume, primarily come from India.
• The US accounts for 12% of total API volume in this analysis.
• China contributes 8% of the total volume of APIs analyzed.
On the finished dosage side, Europe plays a lesser role, with the US the important source for injectables and India for solid dosage forms.
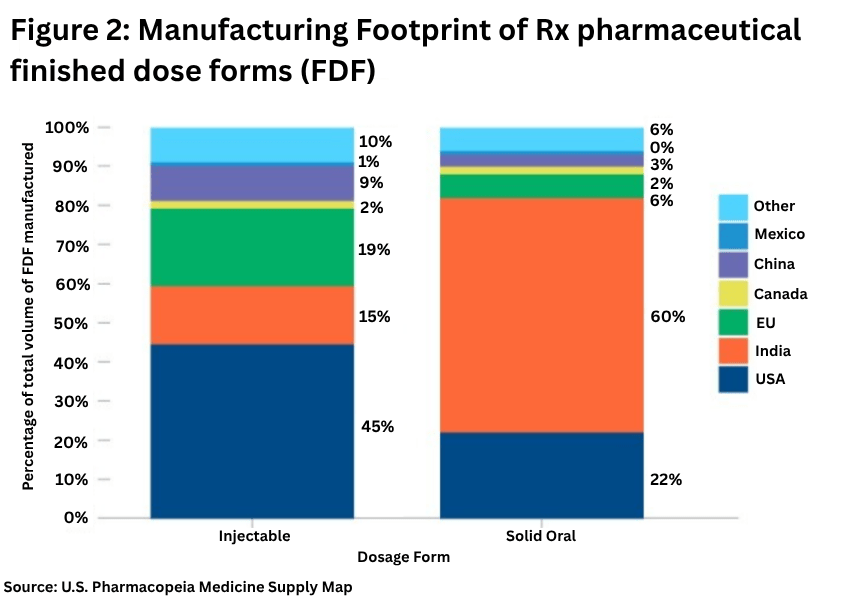
The USP analysis showed (see Figure 2 above)
• The US is the largest manufacturer of injectables, with 45% of production volume, followed by the EU with 19% of production volume.
• For solid oral dosage forms, India has 60% of production volume, followed by the US with 22% of production volume. Market shares have remained relatively unchanged over 2022 and 2024.