How is the US Bio/Pharma Market Performing?
After reaching growth of 12% in 2021, in large measure due to COVID-19 products, growth in the US bio/pharma market is projected to moderate to pre-pandemic levels. What are the near-term outlook and key trends?
Snapshot: US bio/pharmaceutical market
A key barometer of the health of the global bio/pharmaceutical market is the performance of the US market, the largest national market with an approximate 40% share. So how did the US market perform in 2021, and what can be expected in the near term? What are the key trends driving current and projected performance?
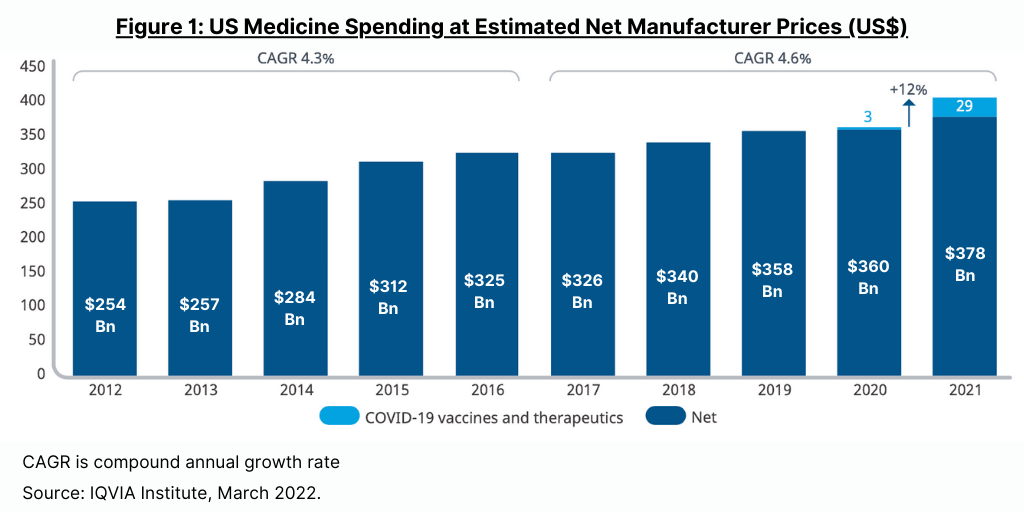
Spending on medicines in the US, at estimated net manufacturer prices, reached $407 billion in 2021, up 12.1% over 2020, as COVID-19 vaccines and therapeutics became widely available and added $29 billion in related spending, according to a new report by the IQVIA Institute for Human Data Science, The Use of Medicines in the U.S. 2022: Usage and Spending Trends and Outlook to 2026. In 2021, the non-COVID medicines market in the US grew more slowly, at only 4.9%, with growth tempered from the growing impact of biosimilars, which increased significantly, offsetting increased use of branded medicines.
Figure 1 outlines recent growth trends. While spending growth slowed in 2020 to less than 1%, from a combination of impacts on volume and spending on newly launched medicines, the pandemic impact was reduced in 2021. Net spending in the past five years (2017–2021) has grown at a compound annual growth rate (CAGR) of 4.6%, including for COVID-19 products, but only 3.1% for all other medicines, reflecting a slowing trend without these new treatments. Medicine spending in the US grew $82 billion over the past five years (2017–2021), with COVID-19 products contributing $29 billion. In the prior five-year period (2016–2020), US medicine spending increased by 4.3%.
Although health services utilization returned to pre-pandemic levels by the end of 2021, it has yet to make up for the pandemic-induced backlog in missed patient visits, screenings and diagnostics, elective procedures, and new prescription starts, according to the IQVIA Institute report. However, prescription drug use in the US reached a record level of 194 billion daily doses in 2021 as new prescription starts for both chronic and acute care recovered from the slowdown recorded in 2020. Spending on medicines in the US is expected to return to pre-pandemic growth trend lines by 2023 despite year-to-year fluctuations and incremental spending on COVID-19 vaccines and therapeutics. The IQVIA Institute projects a CAGR of 2.1% (range of 1-4%) for the US market through 2026, which is comparable to pre-pandemic levels, and total US market size in 2026 of about $450 billion on a net manufacturer price basis.
Patient out-of-pocket (OOP) costs in the US in aggregate rose $4 billion, or 5.3%, in 2021 to a total of $79 billion, back to the level seen in 2018 after two years of declining costs. The IQVIA Institute report notes that OOP costs remain a significant burden for a relatively small part of the population, even as average costs per prescription were flat or slightly declining.
“The rise in U.S. medicine spending was largely driven by the increased availability of pandemic vaccines, boosters, and treatments. It’s a testament to the resiliency of the biopharmaceutical ecosystem to respond successfully to a healthcare crisis at both the global- and country-level, while continuing to improve outcomes across the broader healthcare spectrum,” said Murray Aitken, IQVIA Senior Vice President and Executive Director of the IQVIA Institute for Human Data Science, in commenting on the report. “However, the $4 billion increase in OOP [out-of-pocket] costs for patients matched the historical high previously seen in 2018, which is a trend we will need to continue to watch.”
Specialty medicines on the rise
A continuing trend is the increased market share of specialty medicines in the US market versus traditional medicines. Specialty medicines are defined by IQVIA as those medicines that treat chronic, complex or rare diseases and possess additional distribution, care delivery and/or cost characteristics, which require special management by stakeholders. Specialty medicines in the US now represent 55% of net manufacturer revenue compared to 28% in 2011. The rise in specialty spending has been predominately driven by medicines for autoimmune diseases and oncology, where spending has increased 459% and 226%, respectively, since 2011 on a net basis, according to the IQVIA Institute report. Over the same period, traditional therapies have generally faced declining spending as many had faced patent expiries and had not had newer generation therapies introduced into the classes over time. This pattern, for example, has driven mental health and cardiovascular classes to 38% and 56%, respectively, of their 2011 level of net spending as of 2021, according to the IQVIA Institute report.
New product spending
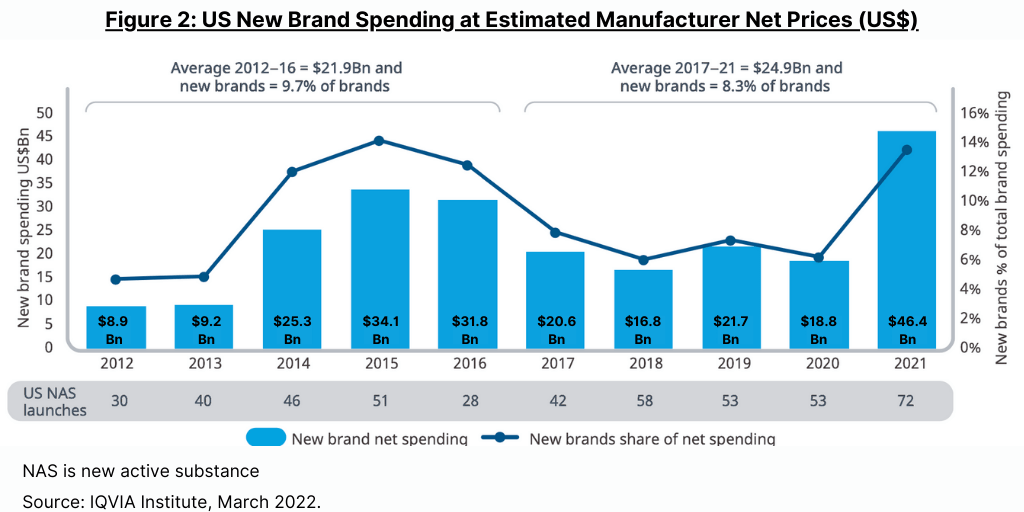
In looking at spending on new products in the US over the past five years (2017–2021), new products, including 278 new active substances that launched from 2017 through 2021, contributed $87.7 billion to spending at manufacturer net prices, according to the IQVIA Institute report. Price increases for protected brands, which have slowed substantially in recent years, declined by $700 million over the past five years. Volume growth experienced by protected brands, most often driven by brands in the three- to five-year period since their launch, contributed $94 billion to growth over the past five-year period (2017–2021).
New medicines launched in the past two years drove spending in the US of $46.4 billion in 2021 (see Figure 2), up from $18.8 billion in 2020, primarily from the $29 billion of spending for COVID-19 vaccines and therapeutics, which was up from $3 billion for these products in 2020, according to the IQVIA Institute report. Increasingly, new medicines are specialty, niche and orphan disease drugs, driving most of the increase in spending of new medicines.
Growth trends for protected brands
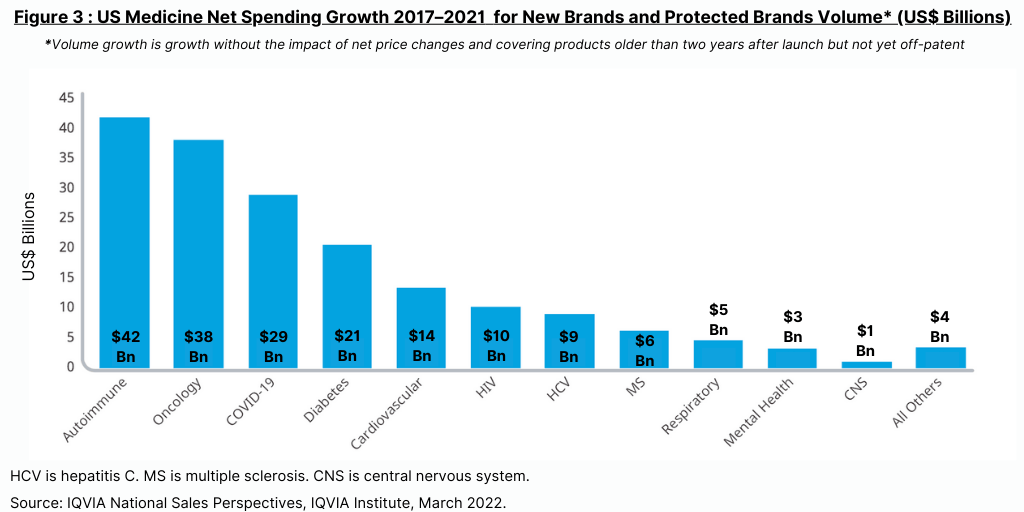
In looking at growth in protected brands (referring to those products not under patent expiry and generics/biosimilars competition), protected brands in total contributed $182 billion in growth over the past five years (2017–2021) led by autoimmune, oncology and diabetes, as well as the $29 billion from COVID-19 vaccines and therapeutics. Volume growth—referring to growth without the impact of net price changes and covering products older than two years after launch but not yet off-patent—has grown to widely differing degrees across therapy areas (see Figure 3). Autoimmune products had net growth from both new products and volume of $42 billion over the past five years, according to the IQVIA Institute report. Oncology added $38 billion while diabetes added $21 billion.
Generics and biosimilars
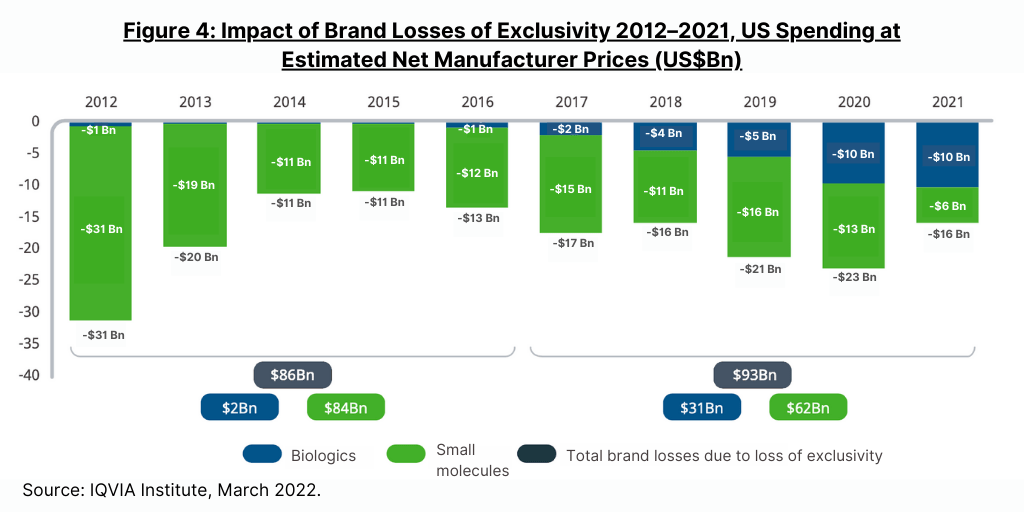
Most of the impact from loss of exclusivity of protected brands in 2021 was from biosimilars introduced in the prior three years, including three molecules in the oncology market—bevacizumab, rituximab, and trastuzumab, according to the IQVIA Institute report. Biologic brand losses were $10 billion in both 2020 and 2021, an increase from the $5 billion in 2019 and totaling $31 billion in the past five years (2017–2021) (see Figure 4). In the same five-year period, small-molecule brand losses were $62 billion, down from $84 billion in the prior five-year period (2016–2020).
A look ahead
The IQVIA Institute projects that US market growth will return to pre-pandemic growth levels by 2023 despite year-to-year fluctuations and incremental vaccine and therapeutic spending. Total net spending on medicines in the US is expected to reach over $450 billion in 2026, up from $407 billion in 2021 and includes spending across all channels and product types. Over the next five years (2022–2026), medicine spending in the US is projected to increase between 2–5% on a list price basis and 1–4% after discounts and rebates. The effect of price growth on overall spending over the next five years is expected be 0 to -3% as list-price increases continue at historically low levels, and net prices will decline in markets with significant competitive intensity. Note: the macroeconomic outlook, including inflation and the potential for recession, are not embedded in these estimates.
On a product basis, growth will be driven by adoption of newly launched innovative products, which are expected to occur at higher levels than in past years with an average of 50–55 new medicines launching per year over the next five years, including those in oncology or with specialty or orphan status. The IQVIA Institute projects an aggregate of $113 billion of new drug spending in the US over the next five years (2022–2026). New brands in the next five years are expected to include large numbers of oncology, immunology, and neurology drugs as well as a significant proportion of rare disease treatments.

