CDMO/CMO Outlook: 2026 in Bio/Pharma Outsourcing

What can CDMOs/CMOs expect in 2026? DCAT Value Chain Insights looks at the issues shaping the market for bio/pharmaceutical outsourcing in the coming year: key trends, fundamentals, and the variables influencing the sector’s performance.
By Patricia Van Arnum, Editorial Director, DCAT, pvanarnum@dcat.org
The unknown: impact of US trade/tariff policy
In gauging the prospects of the CDMO/CMO sector in 2026, a key unknown is the impact that evolving US tariff/trade policy will have on “make-versus-buy decisions” of bio/pharmaceutical companies and to what extent, if at all, such decisions will be altered as a result of cost issues in reducing potential tariff burden or a realignment of manufacturing network strategies based on geographic considerations.
A key part of the fluid US tariff/trade scheme are reciprocal tariffs, country-by-country-based tariffs designed to counter trade imbalances with US trading partners. Part of the policy rationale for imposing tariffs is to increase US competitiveness in manufacturing by creating the financial incentive for companies to base operations in the US to avoid tariff burden. After the US government first announced reciprocal tariffs for individual countries last April (April 2025), those reciprocal tariffs took an up-and-down path in terms of timelines for implementation and the actual tariff rates as well as how they will be applied. In 2025, the US struck deals/framework agreements with key trading partners of particular relevance to the pharmaceutical industry, including the European Union (EU) the UK, Switzerland, Japan, Canada, China, and India.
In 2025 and 2026 to date, the industry has seen a slate of announced expansions in the US—greenfield and expansions of existing facilities for manufacturing, research and development, and other capital projects—by the large bio/pharmaceutical companies. These multi-year investments represent new projects as well as existing projects with announcements for future and recent expansions and total investment amounts made by AbbVie ($100 billion), Amgen ($3 billion), AstraZeneca ($50 billion), Biogen ($2 billion), Eli Lilly and Company ($50 billion), Gilead Sciences ($32 billion), GSK ($30 billion), Johnson & Johnson ($55 billion), Merck & Co. ($70 billion), Novartis ($23 billion), Novo Nordisk ($4.1 billion), Pfizer ($70 billion), Regeneron Pharmaceuticals ($2 billion), Roche ($50 billion) and Sanofi ($20 billion). Whether these investments actually represent a shift to more US-based manufacturing or alter in-sourced/outsourced decision-making, or influence CDMO/CMO selection criteria based on geographic location of suppliers has yet to be determined. As in any industry, shifting manufacturing and supply lines is costly and requires multiple years to implement.
One US trading partner: Europe
In considering this, Europe is an important player in pharmaceutical trade overall with the US, which includes not only bio/pharmaceutical companies but CMDOs/CMOs. In 2024, European Union (EU) exports of medicinal and pharmaceutical products reached EUR 313.4 billion ($364.4 billion), up 13% over 2023, according to information from Eurostat, the statistical office of the EU. At the same time, imports only recorded a modest increase of 0.5%, amounting to EUR 119.7 billion ($139.2 billion). Consequently, in 2024, the EU’s trade surplus in medicinal and pharmaceutical products came to a total of EUR 193.6 billion ($225.1 billion), marking a record high.
The US stands out as the EU’s main trading partner for medicinal and pharmaceutical products in 2024. Exports to the US (38%) were almost two-fifths of all EU exports and were followed at some distance by Switzerland (16%) and the UK (6%). Imports to the EU were also dominated by the US (38%) and Switzerland (33%) followed by the UK (7%). Breaking down the numbers specifically, extra-EU exports of medicinal and pharmaceutical products to the US in 2024 totaled EUR 119.8 billion ($139.3 billion) (38.2% of exports) followed by Switzerland (16.4%; EUR 51.3 billion [$59.6 billion] and the UK (5.8%; EUR 18.2 billion [$21.2 billion])
Flow of APIs and finished dosage forms
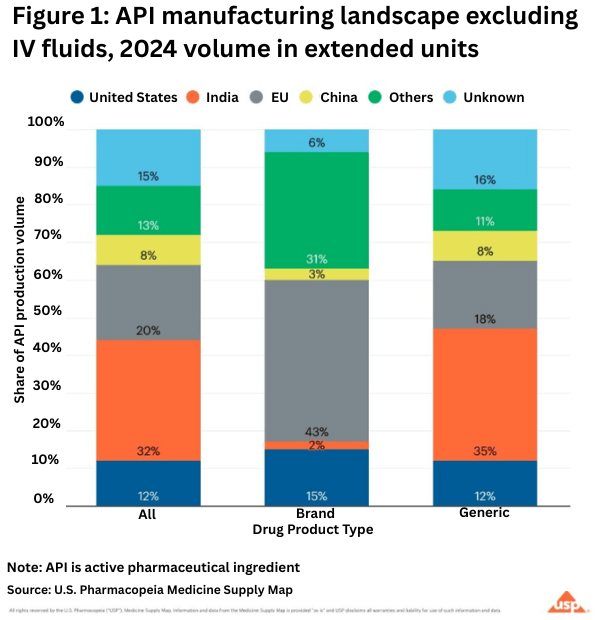
Europe is the largest supplier of pharmaceuticals and inputs imported into the US for innovator drugs, and the EU is the largest source of these imports. Looking at US and ex-US manufacturing of active pharmaceutical ingredients (APIs) on a global basis for both innovator/branded and generic drugs shows the importance of the EU to the US bio/pharmaceutical market. The data are based on the U.S. Pharmacopeia Medicine Supply Map, a data intelligence platform that maps where 94% of US pharmaceutical drug products and their ingredients are made and that identifies, characterizes, and predicts supply-chain risk. On the API side, the USP analysis showed that in 2024 (see Figure 1):
• Half of the APIs for prescription medicines in the US come from India and the EU.
• 43% of branded pharmaceutical APIs comes from the EU.
• Generic drugs, which make up 90% of US prescription drug volume, primarily come from India.
• The US accounts for 12% of total API volume in this analysis.
• China contributes 8% of the total volume of APIs analyzed.
On the finished dosage side, Europe plays a lesser role, with the US the important source for injectables and India for solid dosage forms (see Figure 2).
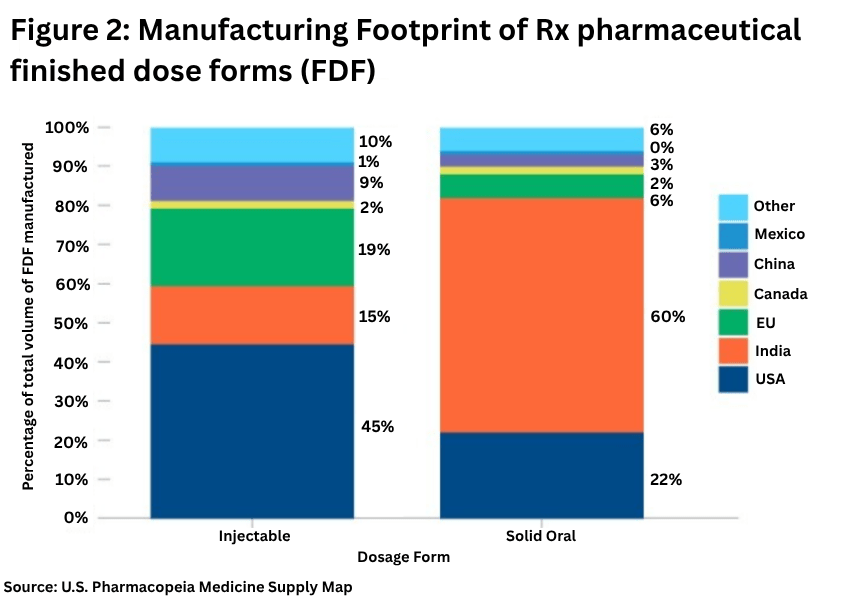
The USP analysis showed:
• The US is the largest manufacturer of injectables, with 45% of production volume, followed by the EU with 19% of production volume.
• For solid oral dosage forms, India has 60% of production volume, followed by the US with 22% of production volume. Market shares have remained relatively unchanged over 2022 and 2024.