Value-Based Metrics: Measuring the Pharma–Supplier Relationship
A newly released benchmarking study by the Drug, Chemical & Associated Technologies Association (DCAT) examines the practices and key metrics used by pharmaceutical companies and suppliers to measure the benefits of value-creation activities in the supply of direct materials.
The study examined the use, effectiveness, and type of value-based metrics used to measure supplier performance and further examined the use of customer-of-choice metrics (i.e., metrics used by suppliers to evaluate their pharmaceutical customers). DCAT Value Chain Insights highlights the key findings.
Inside the study
Metrics are an important part of evaluating the success of the pharmaceutical customer–supplier relationship. Metrics, such as cost reduction and reduction in cycle times, are commonly used, but the DCAT study examined how pharmaceutical companies and their suppliers measure the success of value-creation activities. Delivering value is a key priority for procurement organizations, but the ability to deliver value through practices, such as supplier-enabled innovation, supplier-risk mitigation, improved supply-chain transparency, or other practices, relies on being able to quantify the value derived from those practices.
The DCAT Research & Benchmarking Task Force, composed of DCAT member volunteers, in concert with external consultation developed the study, which was conducted via an online survey from May to July 2017. The study sample included both pharmaceutical companies and suppliers, excluding providers of supply-chain/logistics services, consultants, or other support services. The study was restricted to direct materials (excluding clinical research services) used in pharmaceutical development and manufacturing. Non-pharmaceutical products (diagnostics, nutritional, and animal health) were not part of the study’s scope. The full study is available for download to DCAT members; further information may be found here.
Use of value-based metrics
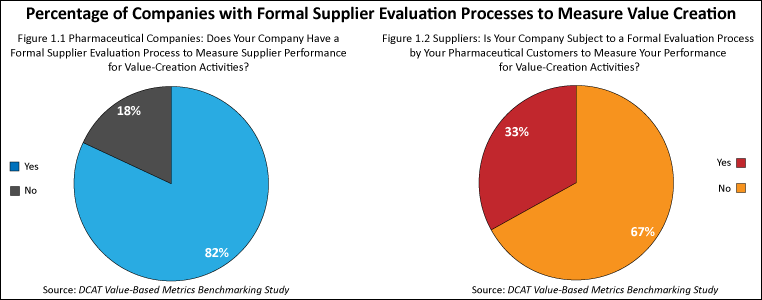
The study found that the use of value-based metrics was fairly high among pharmaceutical companies and suppliers. Four out of five (82%) of the pharmaceutical companies surveyed had formal processes to measure supplier performance for value-creation activities (see Figure 1.1), and two out of three suppliers (67%) surveyed said that they participated in an evaluation process to measure the benefits of value-creation activities (see Figure 1.2). As might be expected, the size of the company played a role in companies having such processes. As the size (measured by revenues) of pharmaceutical companies increased, so did the likelihood of having a formal process in place to measure supplier performance for value-creation activities. Very large suppliers (defined as companies with revenues of $1 billion or more) were more likely to be subject to a formal process to measure supplier performance for value-creation activities while small suppliers (defined as companies with revenues of less than $50 million) were less likely to be subjected to such processes.
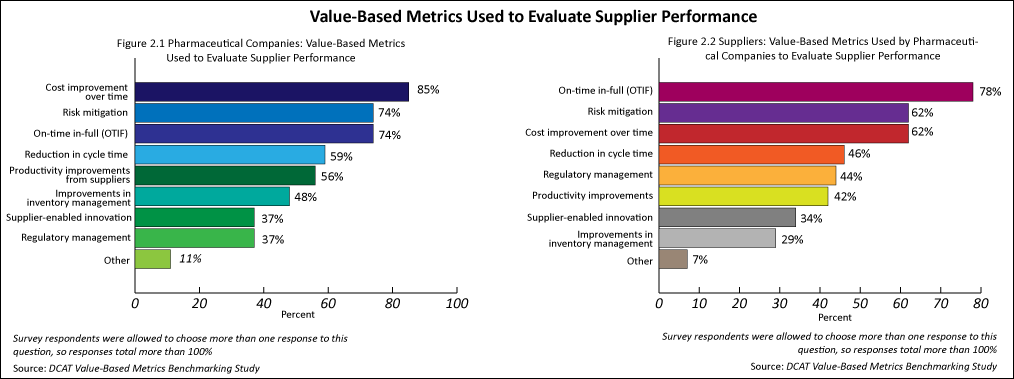
The value-based metrics used by pharmaceutical companies were quite similar to those that suppliers were subject to. The top three metrics cited by both groups were cost improvement over time, risk mitigation, and on-time in-full (see Figures 2.1 and 2.2).
The most common metric used by pharmaceutical companies to measure value-creation activities was cost improvement over time (85%), followed by risk mitigation (74%) and on-time in-full (74%) (see Figure 2.1). Fewer pharmaceutical companies used reduction in cycle time (59%), productivity improvements from suppliers (56%), and improvements in inventory management (48%) to evaluate suppliers.
The most common metrics that suppliers were subject to for evaluating their performance were on-time in-full (78%), risk mitigation (62%), and cost improvement over time (62%) (see Figure 2.2)..Fewer suppliers were subject to measurement by reduction in cycle time (46%), regulatory management (44%), and productivity improvements (42%). Suppliers of active pharmaceutical ingredients (APIs) (defined as small-molecule APIs and advanced intermediates and biologic-based APIs) were more likely to be subject to cost improvement over time for evaluating their performance. Contract development and manufacturing organizations (CDMOs) and contract manufacturing organizations (CMOs) of drug products were more likely to be subject to on-time in-full.
Regarding the most effective metrics for measuring supplier performance for value-creation activities, pharmaceutical companies were more likely to use cost improvement over time and risk mitigation. The suppliers surveyed were more likely to use on-time in-full and much less likely to use cost improvement over time.
Metrics for supplier-enabled innovation
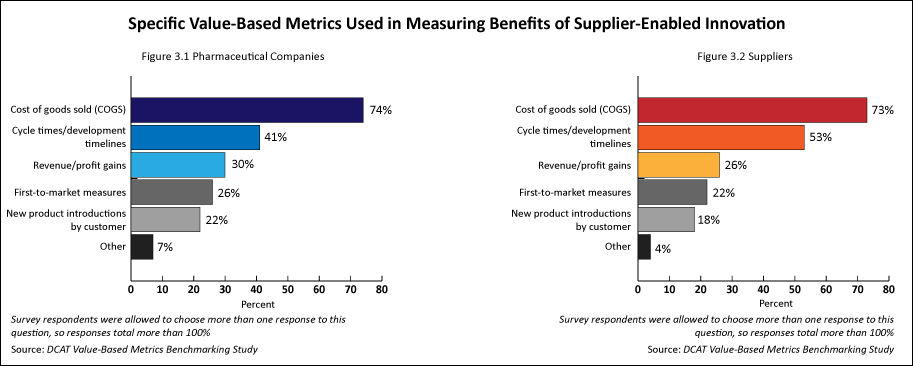
Pharmaceutical companies’ and suppliers’ responses were quite similar in specifying metrics to measure the benefits of supplier-enabled innovation. The top two metrics used by both groups were cost of goods sold and cycle times/development times (see Figures 3.1 and 3.2). Regarding the specific metrics used by pharmaceutical companies in measuring the benefits of supplier-enabled innovation, cost of goods sold (74%) was cited most often, followed by cycle times/development times (41%). Revenue/profit gains (30%), first-to-market measures (26%), and new product introductions by customer (22%) were cited less often (see Figure 3.1). Regarding the specific metrics that suppliers were typically evaluated on for measuring the benefits of supplier-enabled innovation, cost of goods sold (73%) was cited most often, followed by cycle times/development times (53%). Revenue/profit gains (26%), first-to-market measures (22%), and new product introductions by customer (18%) were cited less often (see Figure 3.2).
The most effective metric cited by pharmaceutical companies for supplier-enabled innovation was cost of goods sold (45%). The most effective metrics cited by suppliers in measuring the value of supplier-enabled innovation were cost of goods sold (44%) and cycle times/development times (35%). Regarding the number of projects per year involving supplier-enabled innovation that resulted in measurable value, suppliers tended to engage in more successful projects per year than pharmaceutical companies: 43% of the suppliers engaged in 11 or more such projects per year while 29% of the pharmaceutical companies engaged in 11 or more such projects per year.
Metrics for supplier risk and traceability/transparency of supply chains
Both pharmaceutical companies and suppliers used metrics to measure supplier risk. Pharmaceutical companies used metrics to measure the value derived from supplier-risk mitigation somewhat more often than suppliers (63% vs. 54%, respectively). Pharmaceutical companies used several metrics with fairly equal frequency to measure the value derived from supplier-risk mitigation (business-continuity metrics, metrics for using alternate sourcing, revenue-impact metrics, and metrics to evaluate cost avoidance for supply disruption while suppliers were subject to business-continuity metrics more often than other metrics.
Both pharmaceutical companies and suppliers were involved with metrics to measure the transparency and/or traceability of suppliers’ supply chains. Pharmaceutical companies (82%) evaluated the transparency and/or traceability of suppliers’ supply chains slightly more often than suppliers (75%) were evaluated on this metric.
In measuring how far in the supply chain companies sought transparency/traceability, pharmaceutical companies most often sought transparency and/or traceability to at least one additional supplier beyond their direct supplier while suppliers reported that their pharmaceutical customers most often sought transparency and/or traceability for the complete supply chain (see Figures 4.1 and 4.2). Two-thirds (68%) of pharmaceutical companies typically sought traceability for direct materials to at least one additional supplier beyond their direct supplier (see Figure 4.1). Suppliers noted that their pharmaceutical customers most often sought traceability for direct materials for the complete supply chain (47%) or to at least one additional supplier (42%) (see Figure 4.2).
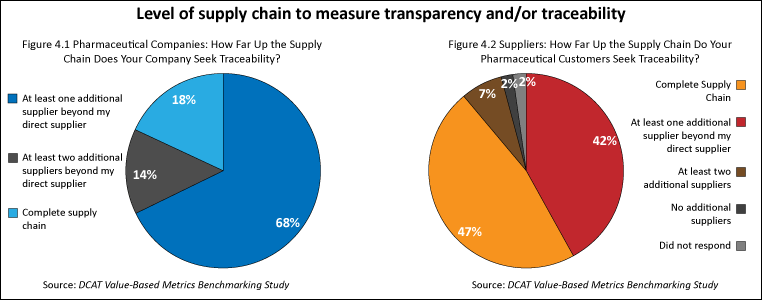
Pharmaceutical companies most often evaluated the transparency of their suppliers’ suppliers via audits (86%) and documentation by their direct supplier (73%). Fewer (36%) of the pharmaceutical companies evaluated their suppliers’ suppliers using certification by third-party auditors. Suppliers were most often evaluated by their pharmaceutical customers in measuring the transparency of their suppliers’ suppliers via audits (83%) and documentation by their direct supplier (73%). Fewer (46%) of the suppliers evaluated their suppliers’ suppliers using certification by third-party auditors.
Sustainability metrics
Both pharmaceutical companies and suppliers were involved with common metrics to measure sustainability practices. The top four sustainability practices in which pharmaceutical companies and suppliers self-reported in which they were involved with were: (1) training in sustainability and compliance, (2) sustainability goals in supplier contracts and bidding processes, (3) supplier diversity, and (4) training in anti-corruption practices. Approximately 70% of both groups used one or more of these metrics.
Customer-of-choice metrics
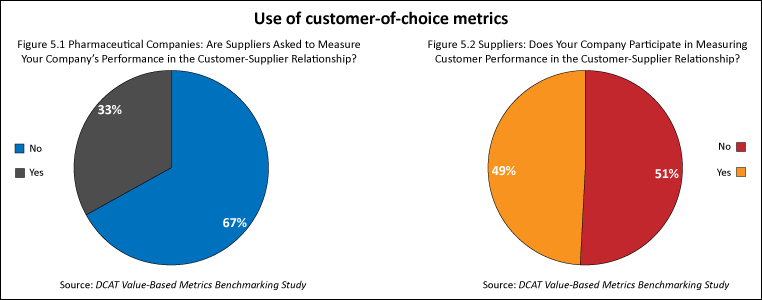
In addition to evaluating metrics used to measure supplier performance, the study also examined the extent to which companies used metrics in which suppliers were asked to evaluate their pharmaceutical company customers (i.e., customer-of-choice metrics). Customer-of-choice metrics were used by a minority of pharmaceutical companies and suppliers. One-third of the pharmaceutical companies had an evaluation process in which suppliers were asked to measure their performance (i.e., customer of choice). Less than one-half (49%) of the suppliers said that they participated in an evaluation process of their pharmaceutical customers (see Figures 5.1 and 5.2).
Comparatively, four out of five (82%) of the pharmaceutical companies surveyed had formal processes to measure supplier performance for value-creation activities, and two out of three suppliers (67%) surveyed said that they participated in an evaluation process to measure the benefits of value-creation activities (see Figures 1.1 and 1.2).
The full study results, including additional information on the effectiveness of metrics and the methods used in value-based metrics, are available to DCAT member companies. Further information may be found here.
A webinar, discussing the results, will held on Thursday, November 16, 2017 from 11:00 to 11:30 AM ET with DCAT Research & Benchmarking Task Force members. Further information, including how to register, may be found here.